
Loamio / Delivery benchmarks
Put water use in context.
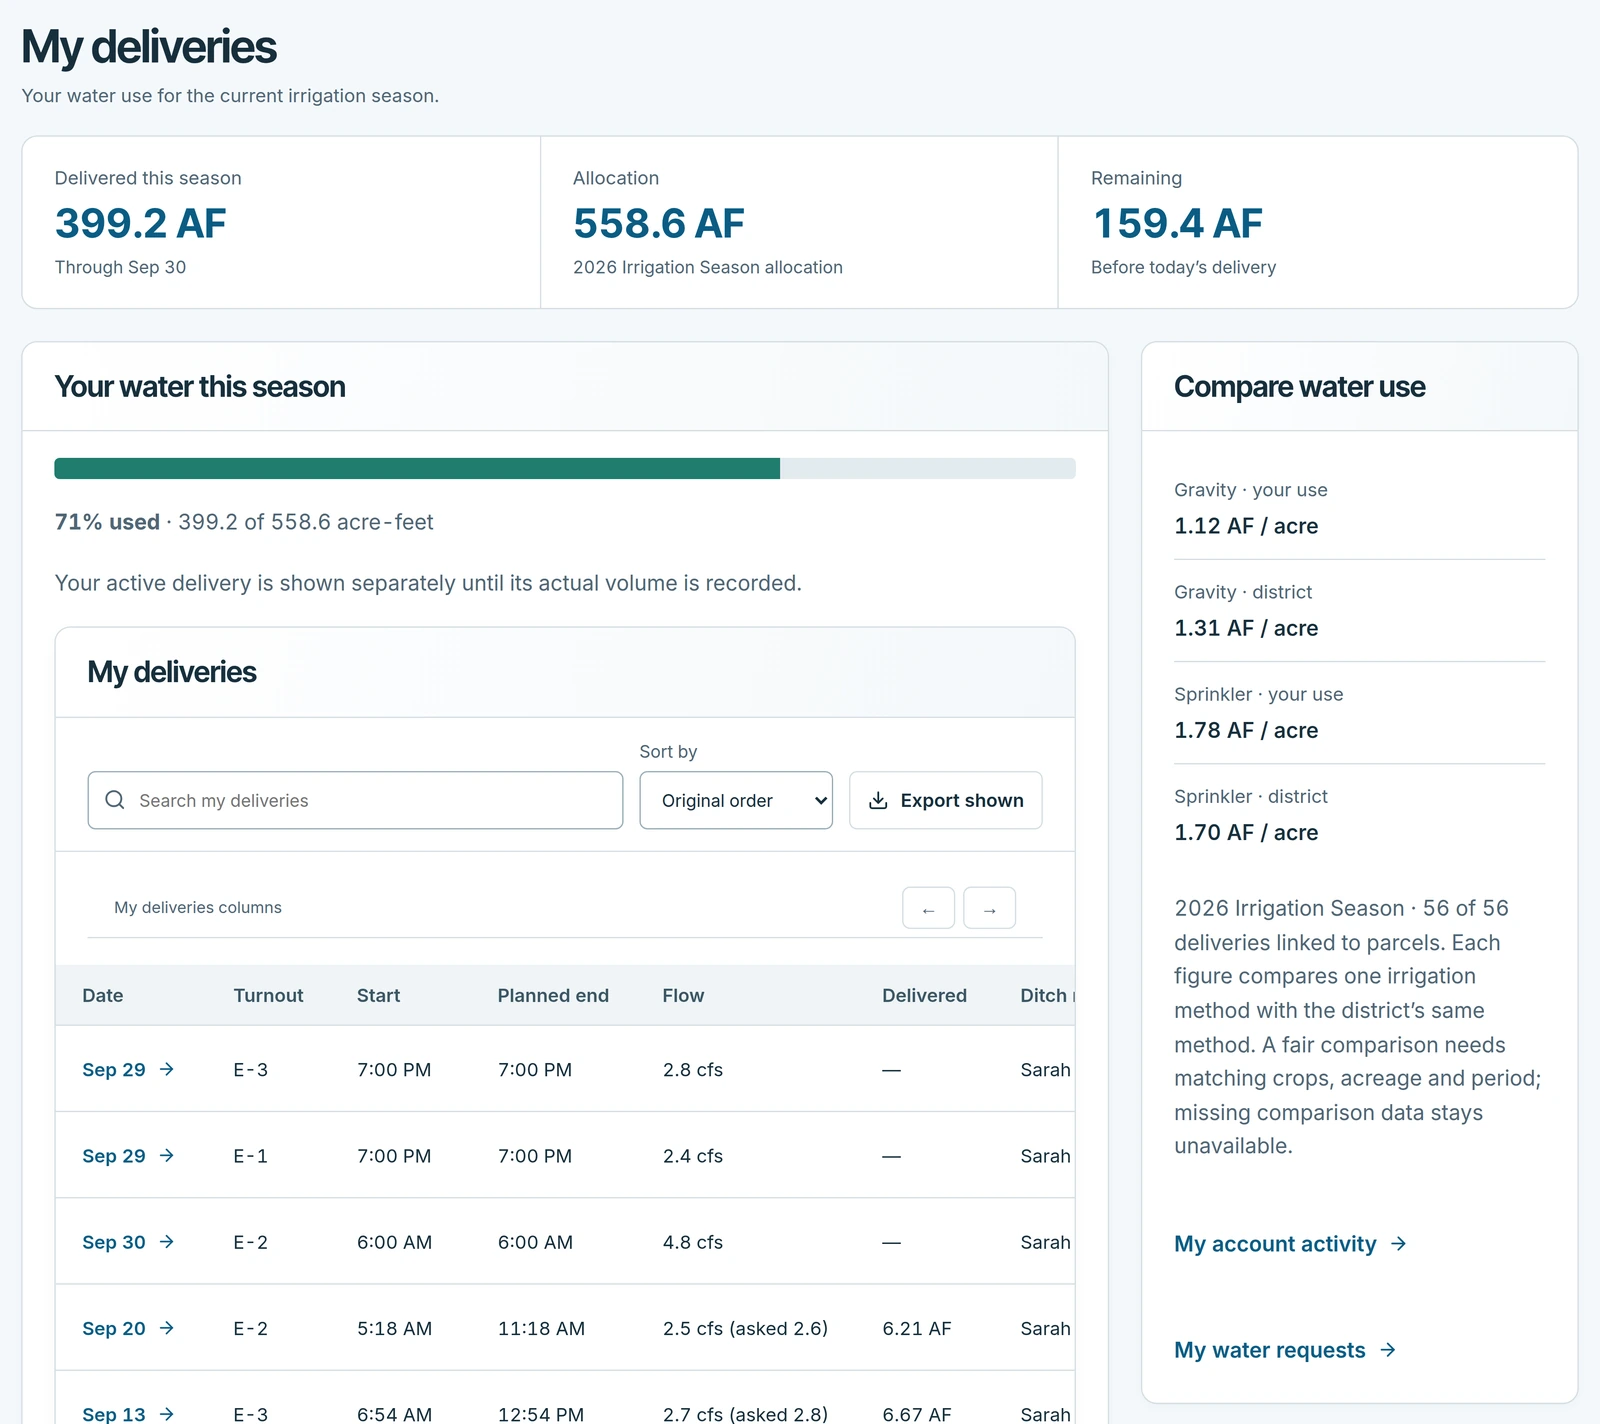
Compare delivery measures by irrigation method, with the period and units in view.
Start with the period.
Read delivered water and allocation for the same season.
Compare like with like.
Review acre-feet per acre for the same irrigation method.
Know the limits.
Crop, acreage, and period affect comparisons. Missing comparison data stays unavailable.
Delivery benchmarks
The working details.
What do the delivery benchmarks measure?
They measure acre-feet delivered per water-righted acre for the current season, grouped by irrigation method. A patron sees their own figure beside the district's figure for the same method on their My deliveries page.
Why is a district figure sometimes unavailable?
A district figure for an irrigation method appears only when deliveries from at least three different patrons are counted in it. With fewer, it could point to one patron, so the panel shows Unavailable.
What is the coverage line?
The line reads 'N of M deliveries linked to parcels.' It counts your deliveries this period that are tied to a parcel; only those can be counted, because the acreage comes from the parcel.
Is a patron's individual water use ever exposed?
Other patrons never see your figures. The district figure is a group figure for one irrigation method and appears only when at least three patrons' deliveries are in it. You see your own figure beside it.
See Loamio at work
See it with your district in mind.
Bring a water order, a run sheet, or an assessment question to a 20-minute walk-through.