The map shows geography
Real locations on real tiles — good for sending a rider to the right headgate, or reviewing a pin a patron dropped in the field.
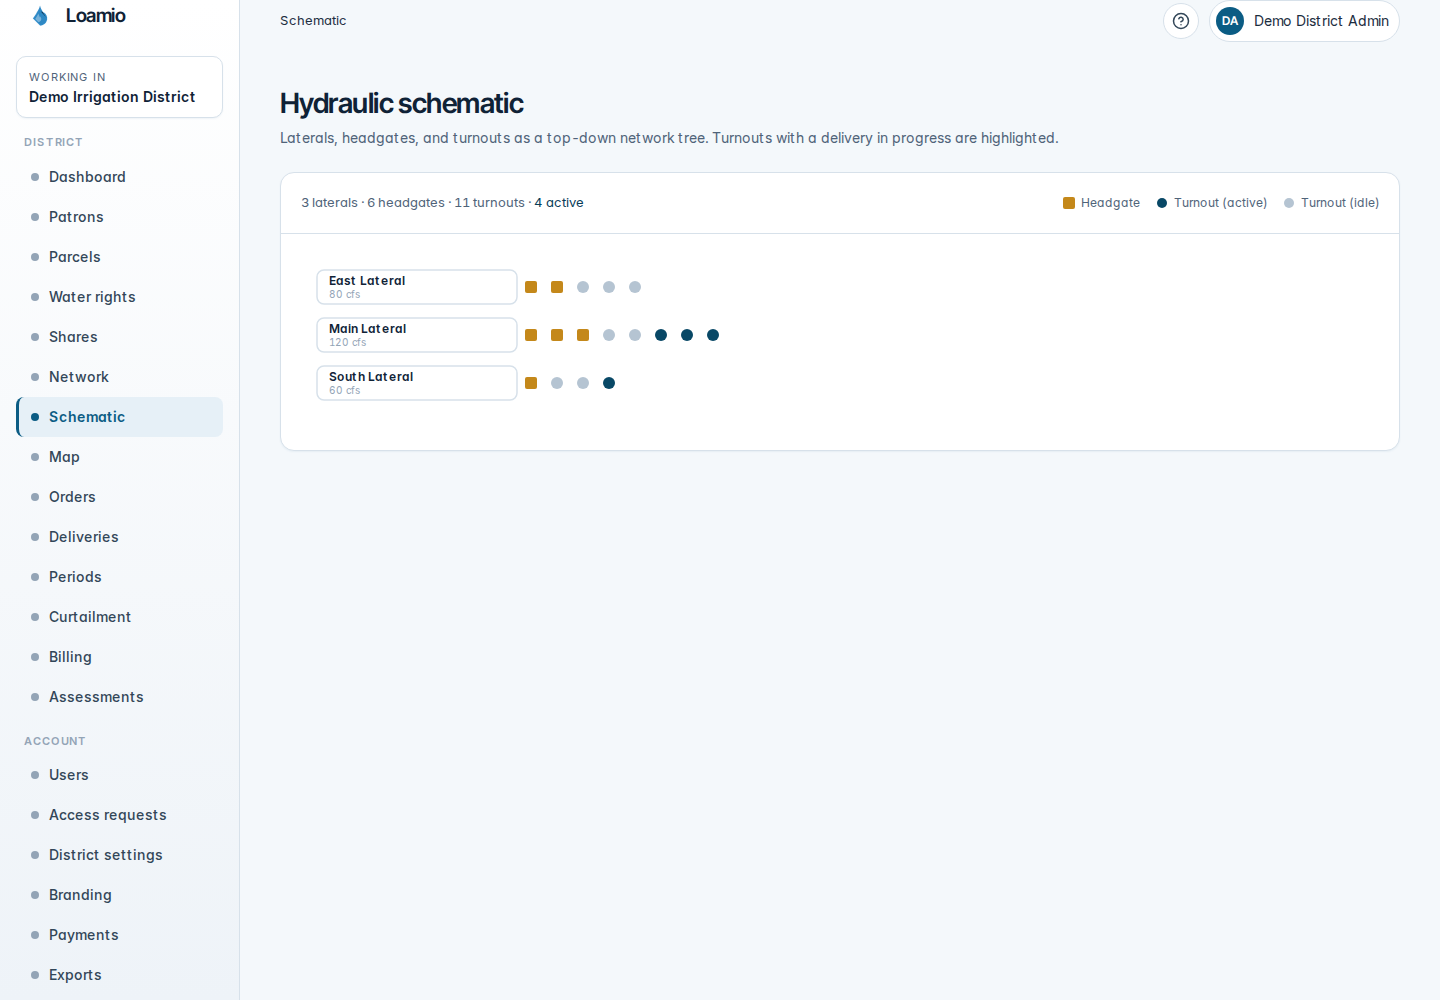
Loamio draws your whole ditch network as a clean, top-down tree — laterals, headgates, and turnouts — and lights up each turnout when water is running through it. It is the diagram your map can't be.
How it works
The schematic starts from the main ditch and branches out — each lateral hangs off the ditch, and each headgate and turnout hangs off its lateral. You read it top to bottom, following the water. There is nothing to draw: Loamio builds the tree from the network you already keep, so a turnout you add to a lateral simply shows up in the right place.
Schematic vs. map
The schematic and the map answer different questions, and Loamio gives you both. The map tells you where — the real-world spot of a headgate on satellite or terrain tiles. The schematic tells you how it all connects — the flow of water through the system, flattened into a tree. Two turnouts a mile apart on the map can sit right next to each other on the schematic if they share a lateral.
Real locations on real tiles — good for sending a rider to the right headgate, or reviewing a pin a patron dropped in the field.
How laterals, headgates, and turnouts connect — good for understanding the order of things down a ditch and who is downstream of whom.
Use the map to find a structure on the ground; use the schematic to see how water reaches it and what else is on the same line.
Active vs. idle
Why it helps
Questions
It is a top-down diagram of your ditch network drawn as a tree — laterals branch from the main ditch, and headgates and turnouts hang off the laterals. It shows how water flows through the system, and each turnout lights up when it has a water order in progress.
The map shows geography — real-world locations on satellite or terrain tiles. The schematic shows topology — how the pieces connect, flattened into a clean tree. Two turnouts miles apart on the map can sit side by side on the schematic if they share a lateral. They answer different questions and work together.
A turnout is active when it has a water order in progress right now — water is actually moving through it. Idle turnouts are drawn quietly; active ones are highlighted, so you can see where water is running across the whole system. The view refreshes about every 30 seconds.
Admins, managers, and ditch riders can open the schematic, and it is read-only for everyone. Riders can check which turnouts are active from the field. Patrons do not see the schematic.
No. Loamio builds the schematic automatically from the network you already have — the laterals, headgates, and turnouts in your district. Add a turnout to a lateral and it appears on the tree. There is no separate diagram to maintain.
Related: Drought curtailment · Delivery efficiency benchmarks · The whole system, simple to run
Next step
A 20-minute walk-through tailored to your district. We respond within one business day.
Book a demo